In Situ MTBE Biodegradation Supported by Diffusive Oxygen Release
Ryan D. Wilson,* Douglas M. Mackay, and Kate M. Scow
Department of Earth Sciences, University of Waterloo, Waterloo, Ontario N2L 3G1, Canada, and Department of Land, Air and Water Resources, University of California, Davis, California 95616
Abstract:
Microcosm studies with sediments from Vandenberg Air Force Base, CA, suggest that native aerobic methyl tert-butyl ether (MTBE)-degrading micro organisms can be stimulated to degrade MTBE. In a series of field experiments, dissolved oxygen has been released into the anaerobic MTBE plume by diffusion through the walls of oxygen-pressurized polymeric tubing placed in contact with the flowing groundwater. MTBE concentrations were decreased from several hundred to less than 10 g/L during passage through the induced aerobic zone, due apparently to in situ biodegradation: abiotic MTBE loss mechanisms were insignificant. Lag time for initiation of degradation was less than 2 months, and the apparent pseudo-first-order degradation rate was 5.3 day-1. Additional MTBE was added in steps to raise the influent concentration to a maximum of 2.1 mg/L. With each step, MTBE was degraded within the pre-established aerobic treatment zone at rates ranging from 4.4 to 8.6 day-1. Excess dissolved oxygen suggested that even higher MTBE concentrations could have been treated. Continued flow through the treatment zone was repeatedly confirmed through tracer and other tests. These and others' results suggest that it is possible to create permeable in situ treatment zones solely by releasing oxygen to support native microbial degradation of MTBE.
 |
Figure 1: Map of the vicinity of site 60, Vandenberg Air Force Base (VAFB), CA. The fine dashed line encloses all MTBE detections greater than 2 g/L (19). The area enclosed by the heavier dashed line is the estimated extent of detectable BTEX species. Noted on the figure are the locations of some of the monitoring conducted as part of our project, notably transects A-C. The close up reveals orientation and scale of two field experiments: (a) the Longitudinal Trench Facility (LTF) and (b) the Panel Test. |
|
|
|
||
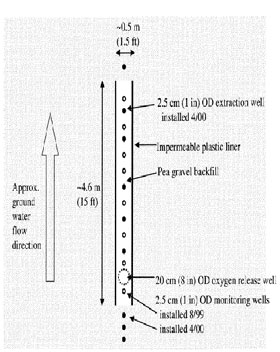 |
Figure 2: Plan view of the LTF. Note that the pea gravel backfill (clear) is in contact with the formation (stippled) at its up gradient and down gradient ends but is separated from it on the sides by an impermeable geotextile. The approximate locations of various wells are depicted. |
|
|
|
||
 |
Figure 3: Schematic of cylindrical oxygen emitter. The frame (detail to left) is constructed to allow relatively unimpeded horizontal flow of groundwater, thus allowing good contact of the water with the coils of tubing. The tubing supports are notched to hold the inner and outer tubing coils at different radial distances from the center. |
|
|
|
||
 |
Figure 4: MTBE vs time at three points along the flow path into and through the LTF. The schematic to the right indicates the locations of the monitoring points. As noted above the graph, the oxygen supply was on during the first 107 days, off until day 192, and back on for the remainder of the time depicted. |
Reproduced with permission from Environ. Sci. Technolo. 2002, 36, 190-199. Copyright 2002 Am. Chem. Soc.
Entire publication available at: http://pubs3.acs.org/acs/journals/toc.page?incoden=esthag&indecade=
0&involume=36&inissue=2
Acknowledgements: The project described above has been funded since December 1997 by the American Petroleum Institute and also in part by grants from the California MTBE Research Partnership, Chevron Research and Technology Company, GeoSyntec Consultants, the Oxygenated Fuels Association (OFA), from the National Institute of Environmental Health Sciences (NIH), and the UC Water Resources Center. The authors are thankful to the numerous individuals at Vandenberg Air Force Base for their considerable in-kind support; to the California Central Coast Regional Water Quality Control Board for their continued interest and support; to G. Durrant, C. Naas, and others at the University of Waterloo for help in the field and the lab; to J. Cullen, D. Mason, and L. Zanini (all formerly with Conor Pacific/EFW) for help at various stages of the field work; and to Isaac Wood and Mark Morando (Santa Barbara) for their service as invaluable field research assistants.