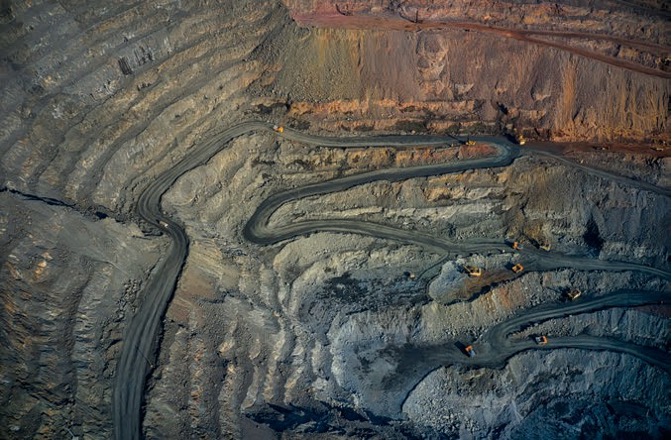
Researchers at the Institute of Open Cast Mining in Poland (Poltegor-Instytut) performed several studies to determine the suitability of Solinst Levelogger water Level dataloggers for hydrogeological monitoring of their mining operations.
Through pumping tests and other studies, they showed that continuous, high-frequency water level data is critical to accurately track the effects of mining operations on groundwater resources and surface water-groundwater interactions.
The following is the (translated and edited) article about their findings that appeared in Discovery Mining.
APPLICATION OF AUTOMATIC GROUNDWATER LEVEL DATALOGGERS IN HYDROGEOLOGICAL RESEARCH
Grzegorz Firlit – “Poltegor-Instytut” Institute of Open Cast Mining, Wroclaw, Poland
This article provides examples of using automatic water level recorders in hydrogeological research. Fluctuations in groundwater caused by anthropogenic factors, such as exploitation of minerals and groundwater and damming of surface waters, may be characterized by a frequent amplitude of changes. Findings show that selecting the correct measurement frequency when measuring groundwater table level changes is essential in interpreting the observed phenomenon and the quality of the results. Automatic recorders enable continuous measurement of the groundwater table position, making them an indispensable tool in monitoring research.
Keywords: automatic water level recorders, ground water monitoring, hydrogeological research
Introduction
Groundwater is an element of the environment that undergoes constant quantitative changes. Changes occur by natural factors, such as seasonal fluctuations, different recharge amounts, and artificial factors – including mine dewatering, groundwater intake operations or surface water damming. Observations and studies of the water environment are carried out in natural conditions, for example, during the exploration and documentation of a deposit, and at later stages related to a mine deposit opening and exploitation, and then reclamation of post-mining excavations. Recognizing the natural conditions and changes occurring under the influence of dewatering makes it possible to reliably assess the impact of dewatering on surface watercourses and natural and artificial water reservoirs, groundwater resources, the functioning of groundwater intakes, soils, vegetation, agricultural land and forests, surface and groundwater chemistry, and land subsidence. Many authors have dealt with the issue of groundwater monitoring in Poland. Here, we can mention, among others, Kazimierski B., Piechowska-Kazimierska E.[4]; Kazimierski B., Małecka D., Różkowski A. [3]; Błaszyk T., Hordejuk T., Górski J., Płochniewski Z. [1]; Krogulec E., Mikołajków J., Jóźwiak K., [5].
Data on the hydraulic parameters of aquifers determined from pumping tests in single wells and multiple wells is critical. They make it possible to assess the hydraulic parameters of aquifers and semipermeable formations. Studies performed in watercourses and reservoirs make it possible to assess the water conductivity of riverbeds and lake sediments. In groundwater monitoring, it is essential to properly match the frequency of measurements to the observed phenomenon, which allows a proper assessment of the ongoing environmental changes. In this regard, automatic groundwater level recorders are a very helpful tool.
Use of automatic groundwater level recorders under conditions of high-frequency water level changes
As part of the hydrogeological studies carried out at the “Poltegr-Institute”, Levelogger 5 Junior dataloggers from Solinst (Fig. 1) were used to measure changes in the position of the groundwater table, allowing automatic measurement of water table fluctuations. They are absolute dataloggers, measuring the total pressure exerted on the sensor (water column and atmospheric pressure). Accurate results are obtained by installing a Barologger, a surface recorder that measures atmospheric pressure. It is used to compensate readings from Levelogger 5 Junior by atmospheric pressure. Such a set allows measurements with an accuracy of 0.01-0.02% for the full measurement scale and logging at a frequency of 0.5 sec to 99 h. The recorder can store up to 40,000 sets of data. In addition, it is equipped with a Platinium RTD temperature sensor, which allows measurement with an accuracy of ±0.1°C. Temperature measurements take place at the same frequency as water level measurements. Programming and reading data from the loggers is done using an optical docking station for a PC (Field Reader 5). Levelogger software allows viewing data stored in the logger as a table and graph, exporting data to other formats, and programming the logger.
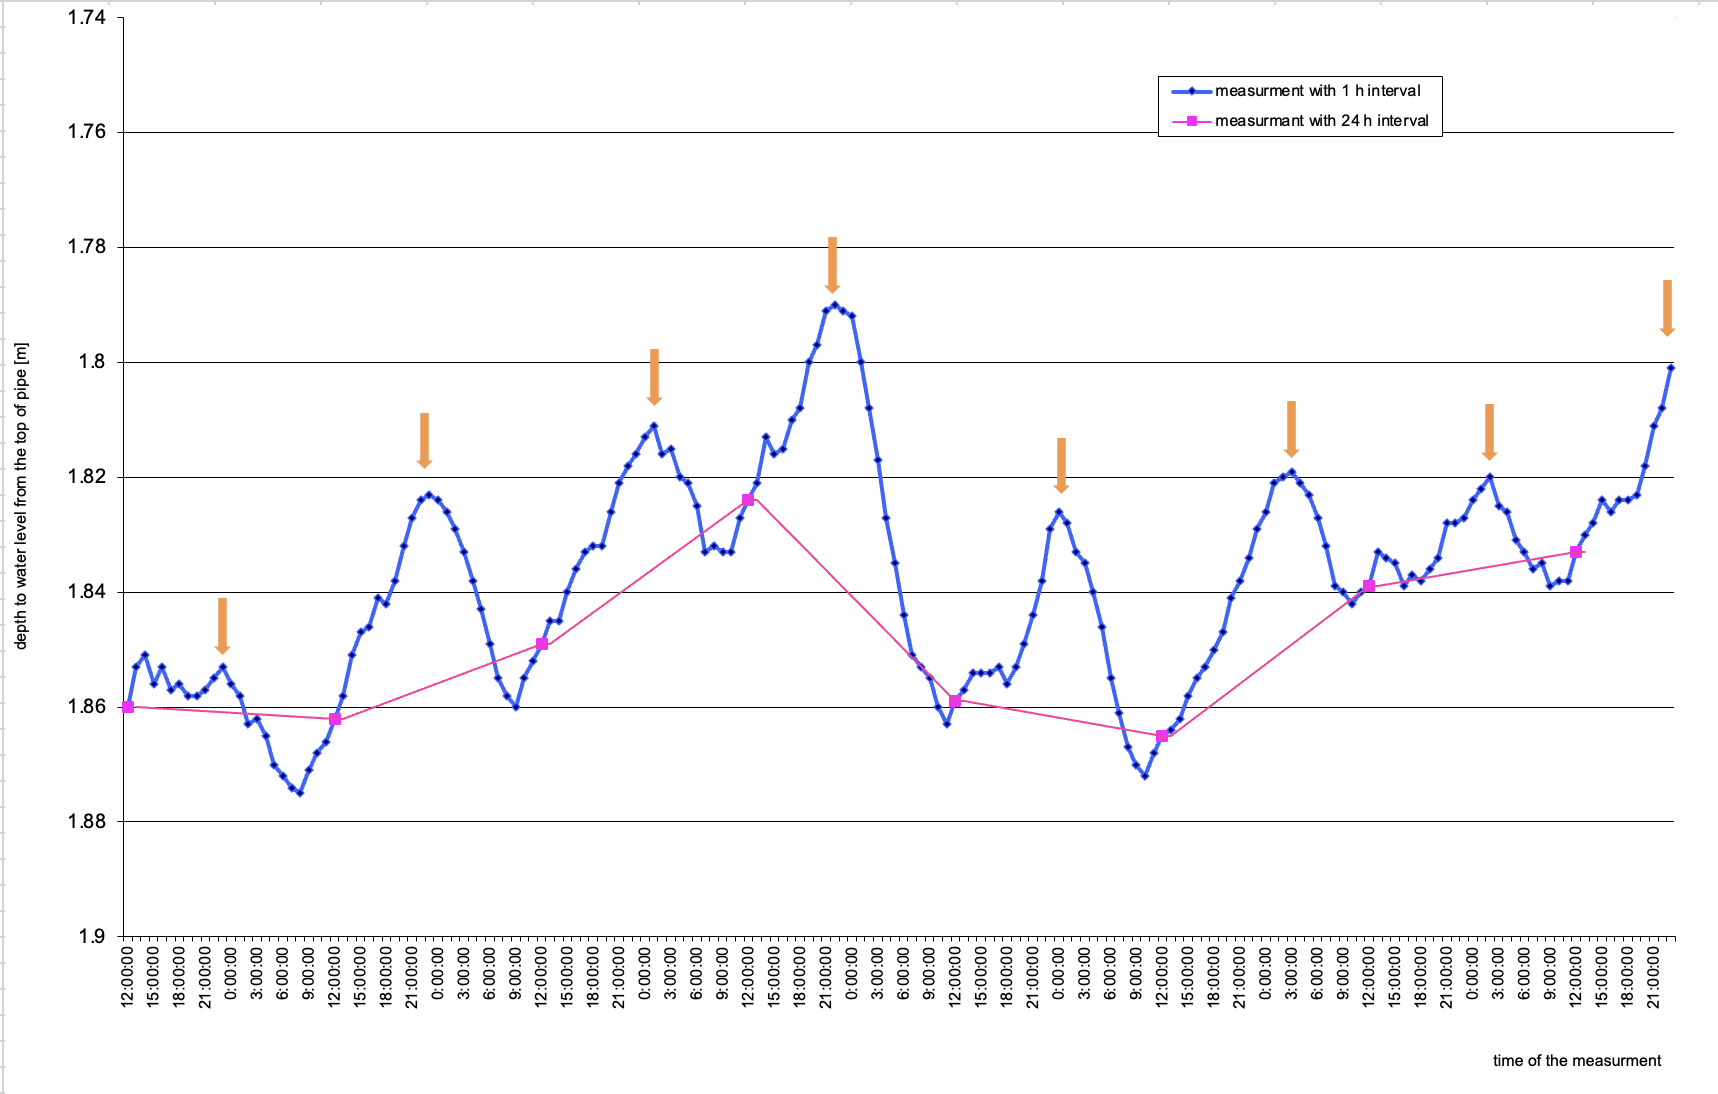
Automatic groundwater level dataloggers were used for measurements in the region of the lower reservoir of the pumped storage power plant. The piezometer where the measurements were carried out is about 300 m from the reservoir’s shoreline, capturing the first aquifer of medium and coarse-grained sands with an admixture of sand and gravel. The piezometer was installed for 191 hours, with an automatic water level datalogger programmed to log at an hourly frequency. The graph from the collected results (Fig. 2) shows clear maxima of the groundwater level, repeated regularly every 24 ± 2 hours. The data indicates the influence of the surface water level of the lower reservoir of the pumped storage power plant on the groundwater of its immediate vicinity. These fluctuations are closely related to the rhythm of operation of the pumped storage power plant, filling and emptying the lower reservoir of the power plant. If measurements were made at a frequency of every 24 hours and performed in the south, the shape of the graph showing the level of the groundwater table (Fig. 2) would not allow observation of 24-hour cycles of changes in the groundwater level. In such a case, one can only observe at most two maxima, which do not correlate with the operation of the pumped storage plant. Also, the amplitude of fluctuations of the groundwater table differs significantly for measurements made at a frequency of every one hour and 24 hours. For measurements every one hour, it is 0.083 m; for measurements every 24 hours, it is 0.041 m and is twice as small. This example illustrates the possibility of interpreting the obtained results based on a properly selected frequency of measurements.
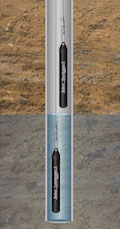
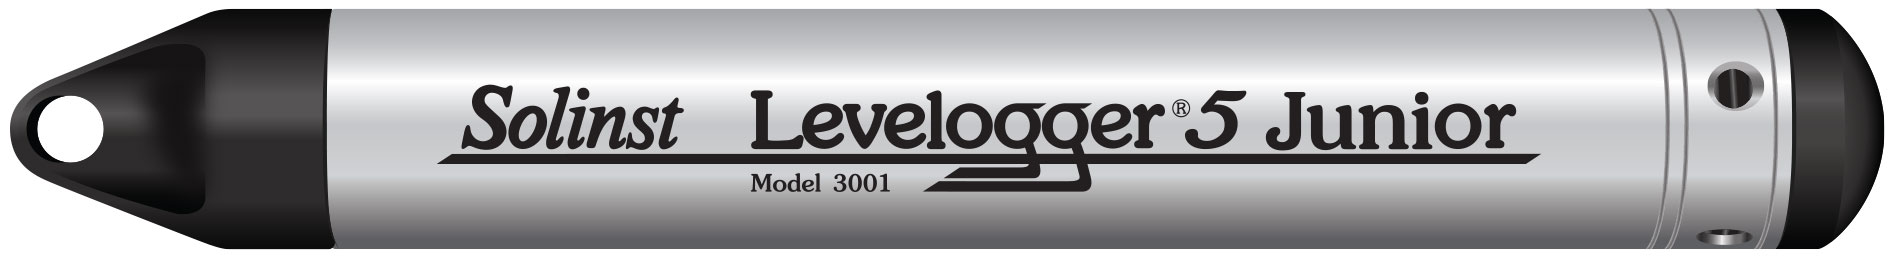
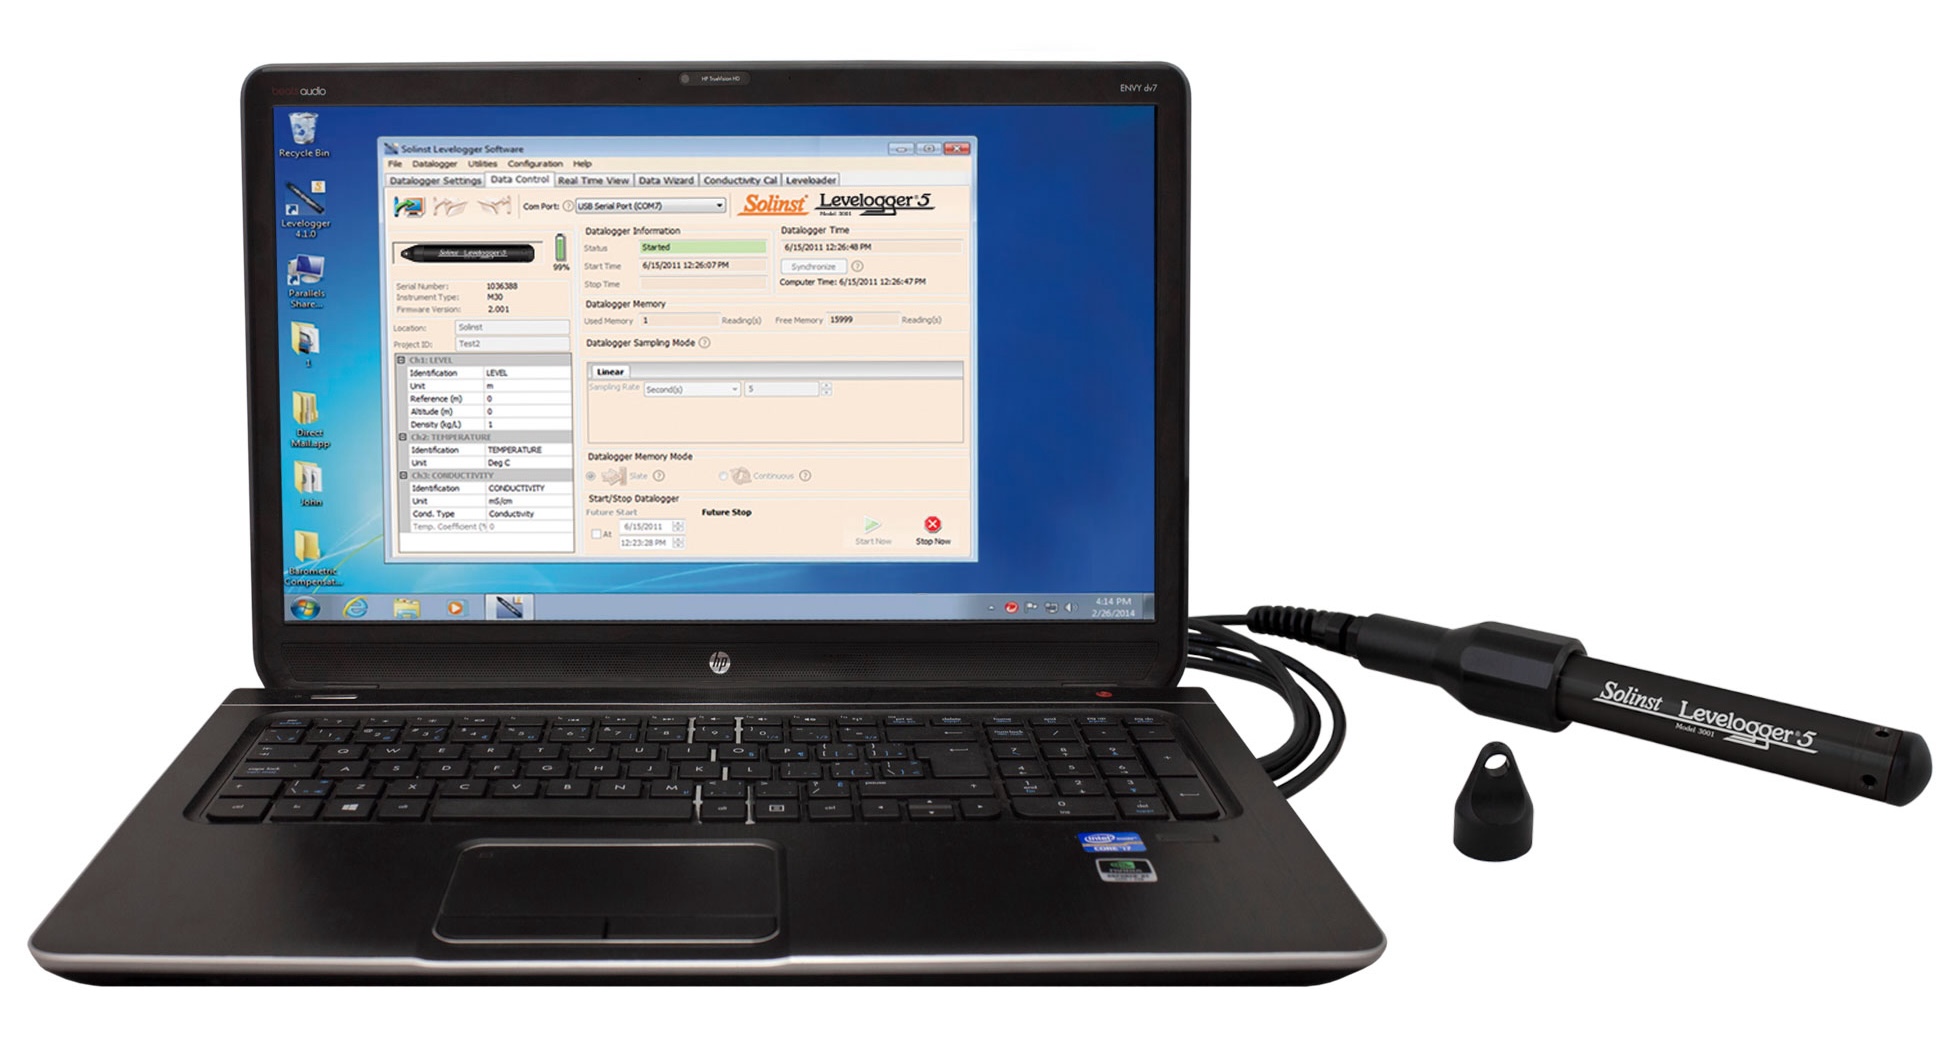
Fig. 1. A – installation scheme of the Levelogger and Barologger in the hydrogeological borehole, B – Levelogger 5 Junior by Solinst, C – software window for connecting the datalogger to a computer and a connected datalogger using the optical docking station.
with the frequency of 1 h and 24 h
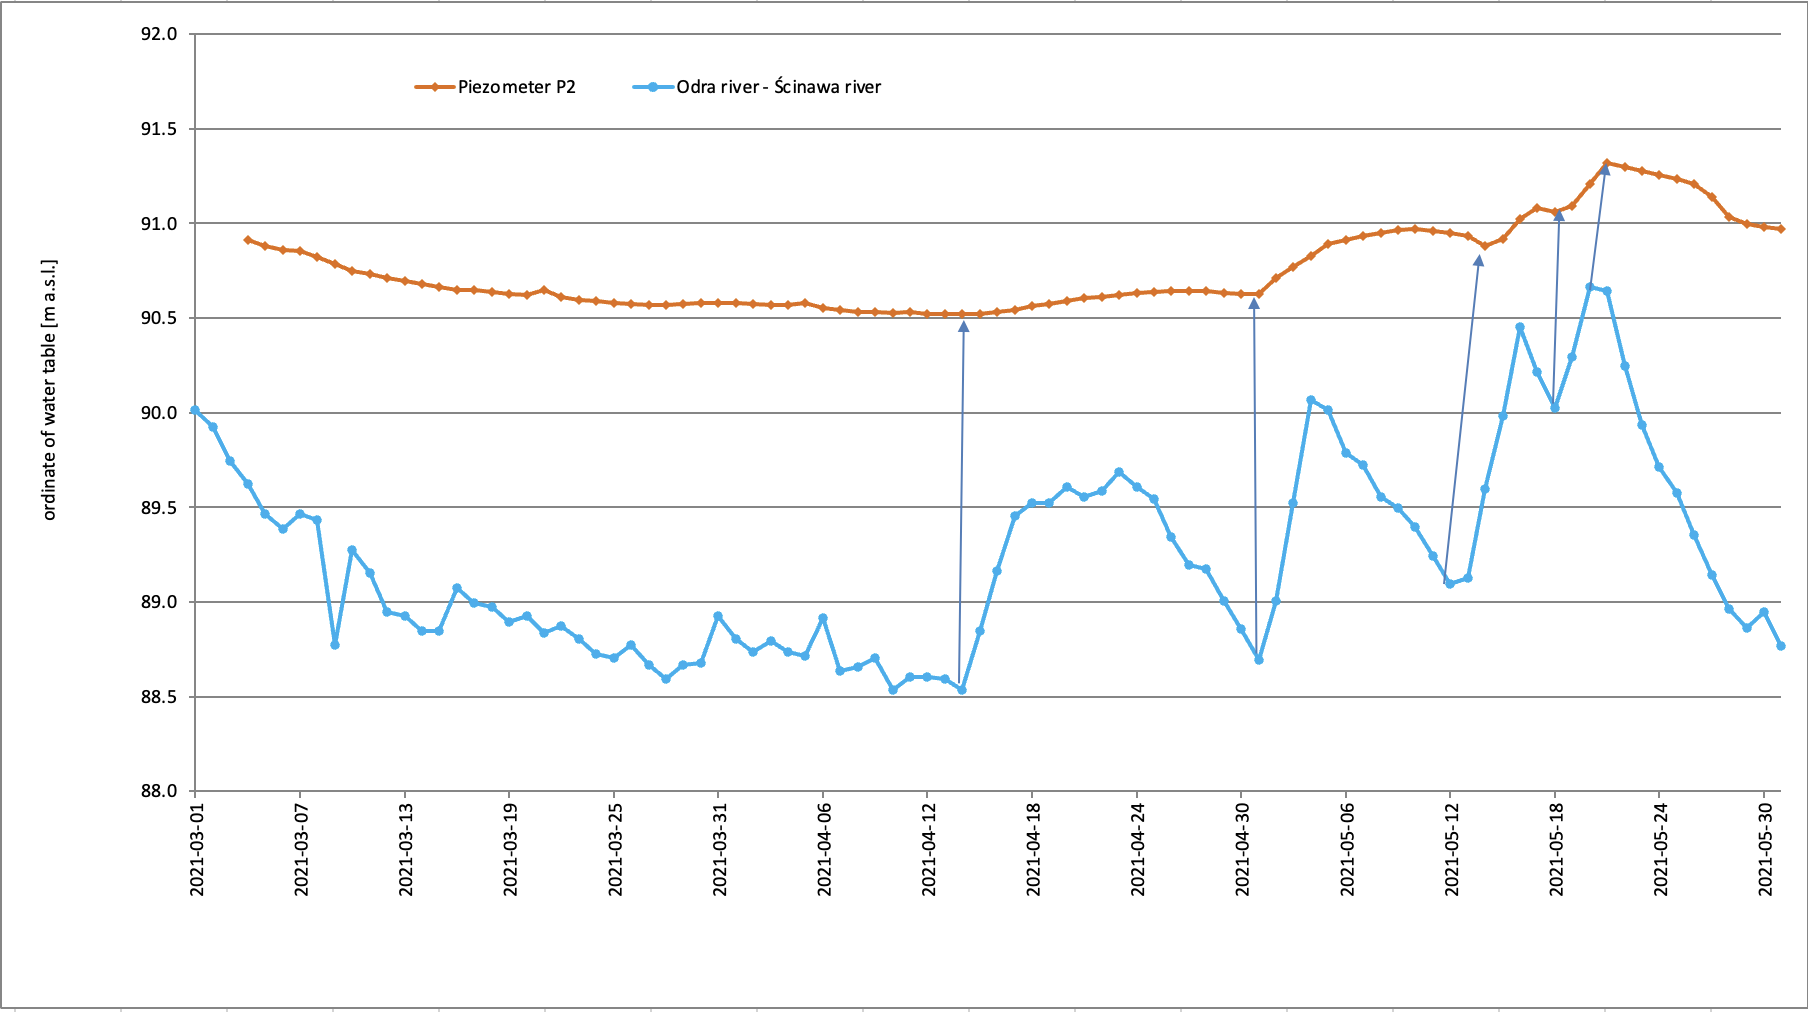
Another example of using automatic groundwater level meters comes from observations of the interaction between surface water and groundwater in an extensive river valley system. In this case, dataloggers were installed in piezometers in the Odra River valley upstream from Scinawa. Piezometer P2, located 600 m from the riverbed, was chosen as a representative point. The graph (Fig. 3) presents the water level in the Oder River at the IMGW water level gauge in Ścinawa, as well as the fluctuation of groundwater in piezometer P2 during March 2021. In the second half of the month, the freshet wave on the Odra River was recorded, and the alarm level at the water level gauge in Ścinawa was exceeded for five days. The Levelogger installed in piezometer P2 was programmed to perform measurements at a frequency of once a day. Measurements made in such a cycle allowed a correlation of the characteristic states of surface and groundwater levels. The data made it possible to determine the response time of groundwater to recharge from surface water, which in this case is 1-2 days. These data can be used to determine the appropriate height of water damming by water stages for meeting environmental requirements in the river valley as an ecosystem dependent on high groundwater levels. Observations carried out at a lower frequency of measurements will not allow a correlation of surface and groundwater levels in the event of the interception of a short-term surge. Manual measurements carried out at a frequency of once a day would force the employment of an observer, which, in the case of a groundwater monitoring network consisting of a dozen or more points, becomes more costly than the installation of automatic dataloggers.
The issue of using groundwater monitoring data to assess the impact of damming structures such as hydropower plants was dealt with by Worsa-Kozak M. and Kotowski A. [7], among others. Modern solutions in the form of automatic groundwater level recorders facilitate the proper interpretation of the monitoring data obtained.
Automatic groundwater level dataloggers are used with great success to monitor changes in the position of the water table during the measurement pumping of hydrogeological boreholes, especially in the piezometer system when there is a need to observe several to a dozen or more piezometers simultaneously. The most sensitive stage is the post-start phase of pumping tests, when water table measurements are made with high frequency, i.e. every 1 minute from the start of pumping up to 15 minutes, every 2 minutes up to 30 minutes of pumping, every 5 minutes up to 2 hours of pumping (Dabrowski S., Przybylek J. [2]). Accurate graphing of the falling water table during the pumping test and its return to a steady state makes it possible to conduct a proper interpretation of the results of a hydrogeological experiment and accurately determine such aquifer parameters as water conductivity (T), filtration coefficient (k), or drainage (µ). Automatic dataloggers can be successfully installed in the observation piezometers of a hydrogeologic well, as well as in the pumping well, after the pumping is completed, during the filling of the created cone of depression. The pump operation disturbs the pressure logger readings, making installing the logger in the pumping well impossible.
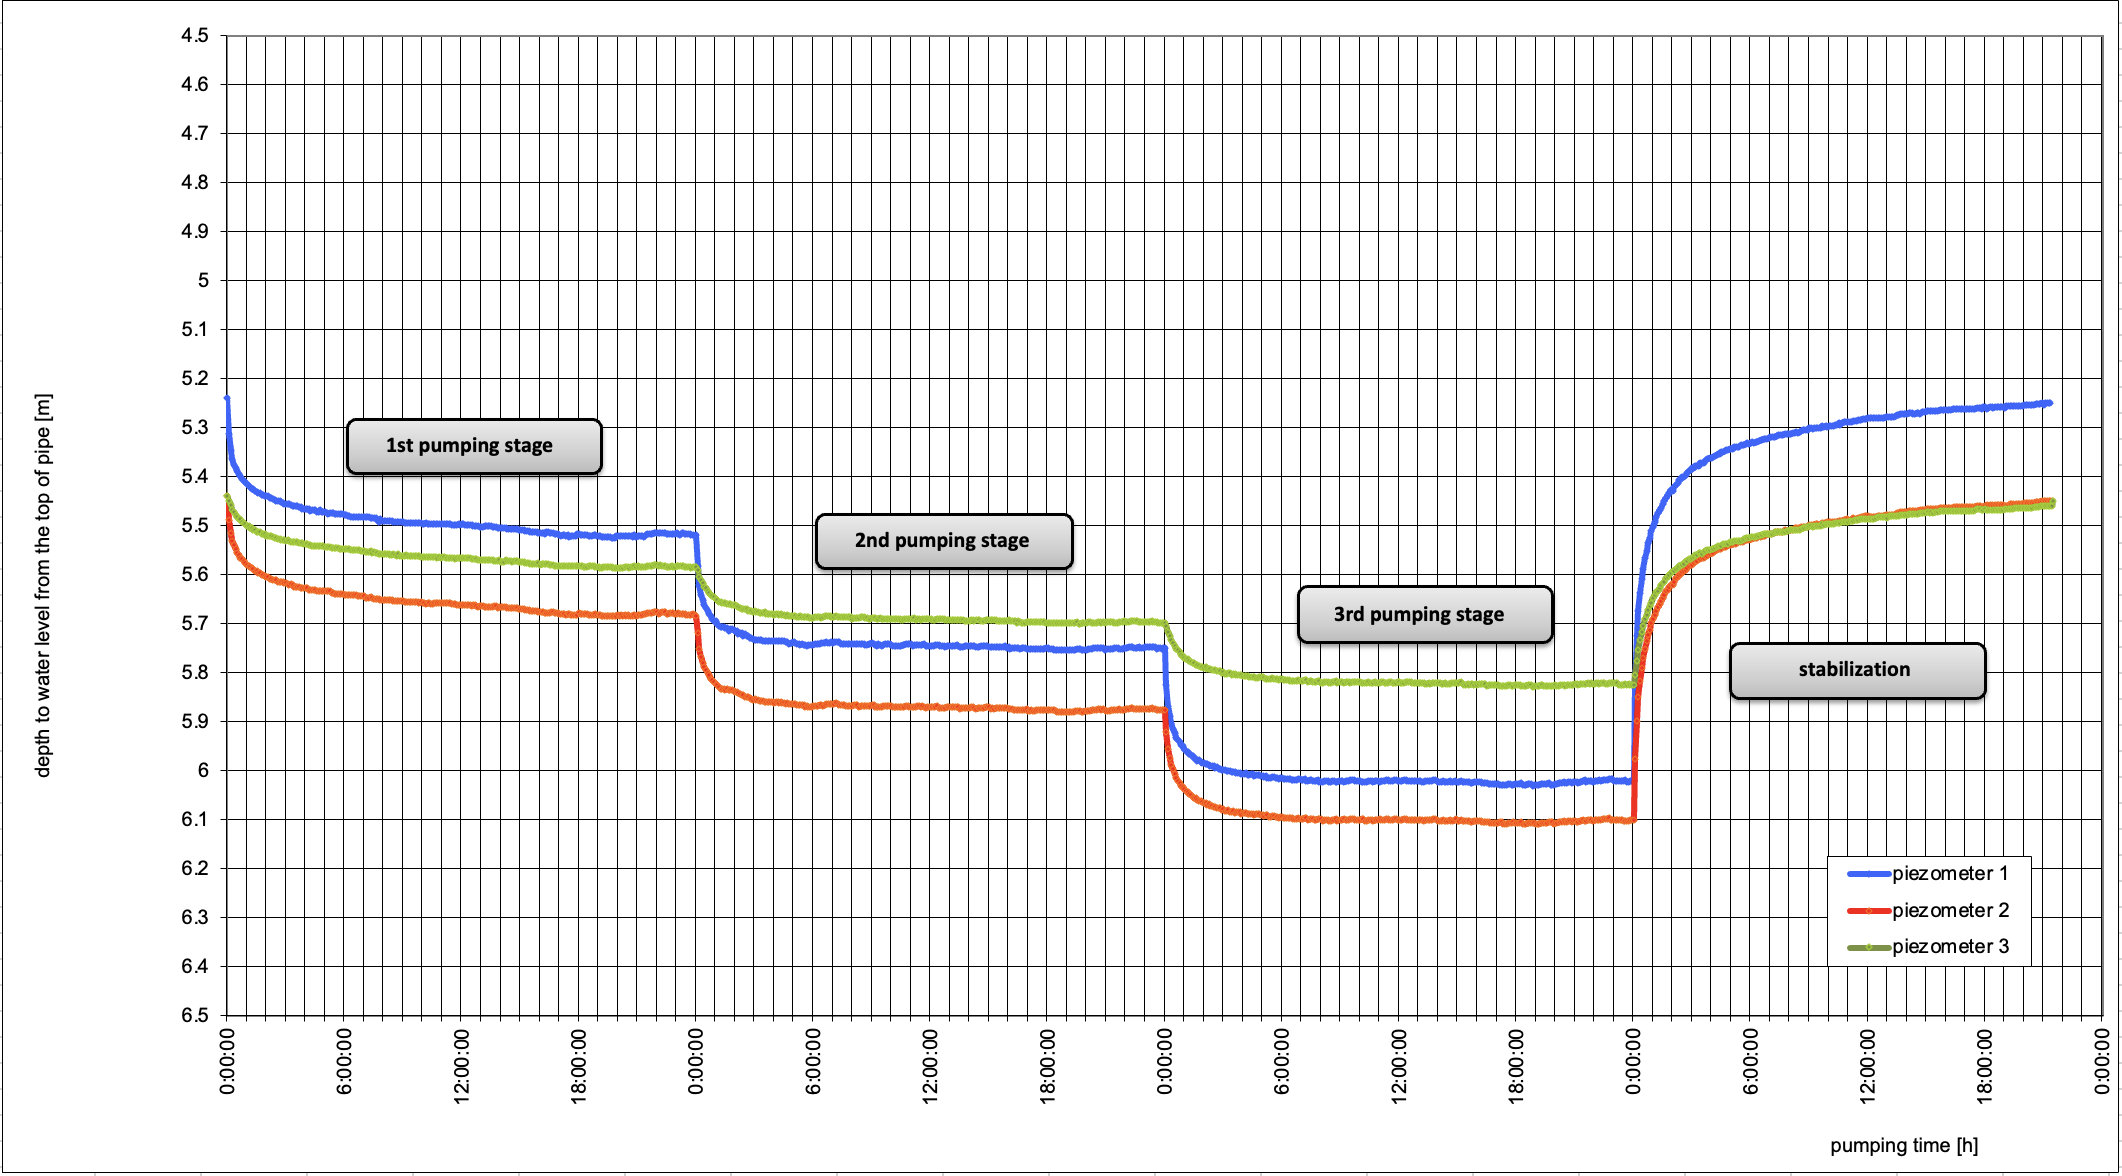
Figure 4 shows the results of groundwater table measurements in the three observation piezometers of the piezometer system during the pumping test. The dataloggers were programmed to measure and log at a frequency of every 5 minutes, which made it possible to obtain accurate graphs of groundwater table fluctuations during pumping tests with three different rates and the stabilization of the groundwater table. The data obtained with such accuracy allows us to draw the pumping curve.
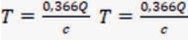
(function s= ƒ(lg r)) and, based on it, the determination of the directional coefficient c:
For a full logarithmic cycle, so for ∆lg r = 1, we have c=∆s. Knowing the magnitude of the coefficient c, the conductivity can be calculated according to the formula:

From the graph s= ƒ(lg r), the extent of the cone of depression can also be determined.
(Dabrowski S., Przybyłek J. [2]). Automatic dataloggers allow the development of high-precision pumping curves, affecting the accuracy of the aquifer or well parameter calculations.
Summary
The above examples illustrate only a few selected applications of automatic groundwater level dataloggers used during hydrogeological studies by “Poltegor-Institute” employees. These devices are particularly useful when it is necessary to make measurements with high frequency or measurements at multiple points simultaneously. They can be successfully used to observe changes in the groundwater table caused by anthropogenic factors, such as mining drainage, intensive groundwater extraction, surface water damming and retention. Changes in the groundwater environment caused by the described factors often occur rapidly, much faster than natural seasonal changes, and measurements made manually will not always allow for proper identification of the scale of the observed phenomenon. It has been shown that it is essential to choose the right frequency of measurements for the phenomenon that is being observed. Measurements made too infrequently can greatly distort the results of observations and affect their interpretation.
Literature
[1] Błaszyk T., Hordejuk T., Górski J., Płochniewski Z., 1991 – Concept of groundwater monitoring. Geo- logical review no. 1, 1991
[2] Dąbrowski S., Przybyłek J., 2005 – Methodology of test pumping in documenting groundwater resources.
Methodological Guide, Ministry of the Environment, Warsaw
[3] Kazimierski B., Małecka D., Różkowski A., 1999 – Purpose, methods and results of groundwater monitoring in Poland.
Bulletin of the National Geological Institute, No. 388 Hydrogeology, pp. 79-114
[4] Kazimierski B., Piechowska-Kazimierska E., 2006 – Monitoring and assessment of the state of groundwater – Monitoring Środo- wiska Przy rodniczego No. 7, pp. 9-19, Kielce Scientific Society, Kielce
[5] Krogulec E., Mikolajkow J., Jóźwiak K., 2005 – Monitoring studies of groundwater of protected areas with different levels of anthropopression. Przegląd Geologiczny, vol. 53, No. 6 (2005)
[6] Worsa-Kozak M., Kotowski A., 2009 – An example of using groundwater monitoring data to assess the environmental impact of hydropower plants. Bulletin of the Polish Geological Institute, Vol. 436, No 436-2 (2009)
Solinst Thanks Michał Oleksiewicz of AquaTerra.pl, Solinst Exclusive Distributor in Poland, for providing the original article.