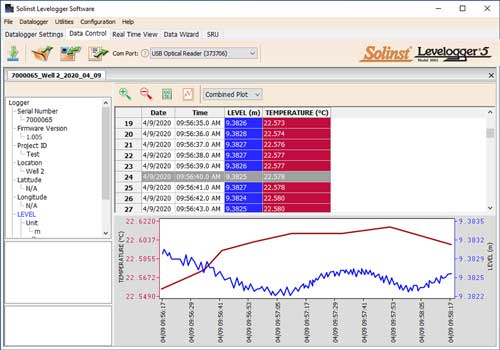
Click the Data Control tab on the Main window. From the Data Control tab you can download data from a Levelogger, display data in tabular or graphic format, and save and export data files.

Figure 7-1 Data Control Tab
Click ![]() to open a *.xle or *.lev file. Multiple files can be opened at the same time and are available for viewing by clicking the File Name Tab on top of the data table.
to open a *.xle or *.lev file. Multiple files can be opened at the same time and are available for viewing by clicking the File Name Tab on top of the data table.
All the Levelogger settings and the channel information effective during data collection are shown on the top left of the window.
The bottom left sections of the window are used to display information after a data compensation has been performed. The middle section displays information from a Barologger, if a barometric compensation is performed, and the bottom section includes information from other compensations, such as offsets or conductivity conversions (see Section 8).
Note:
When you click on a data point in the graph, the corresponding data point will be highlighted in the table. You can also highlight a section of data in the graph. Simply left click on a row number, then hold and drag to include the row number of interest.

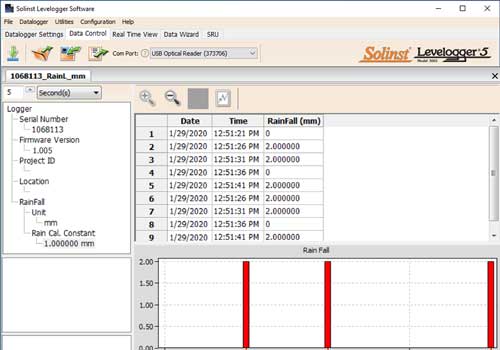
Figure 7-2 Rainlogger Data
When you view data downloaded from a Rainlogger, the RainFall data will be shown in a table and in a bar graph. A drop-down menu appears that allows you to select the time interval at which you would like the data shown, from 1 to 99 seconds, minutes, hours, days, or weeks (this acts like a zoom function). Figure 7-2 shows the data every 5 seconds from the start date and time.
Note:
As there is only one channel of data for the Rainlogger, there are no graphing options.


